
PSE Petroleum Structural Engineering®
Industry-leading structural engineering software trusted by professionals worldwide since 1986.
Powerful capabilities. Exceptional support.
40 years of innovation
Delivering cutting-edge solutions to industry leaders since 1986.


3D Offshore Structural Analysis Software
Petroleum Structural Engineering® (PSE) Software
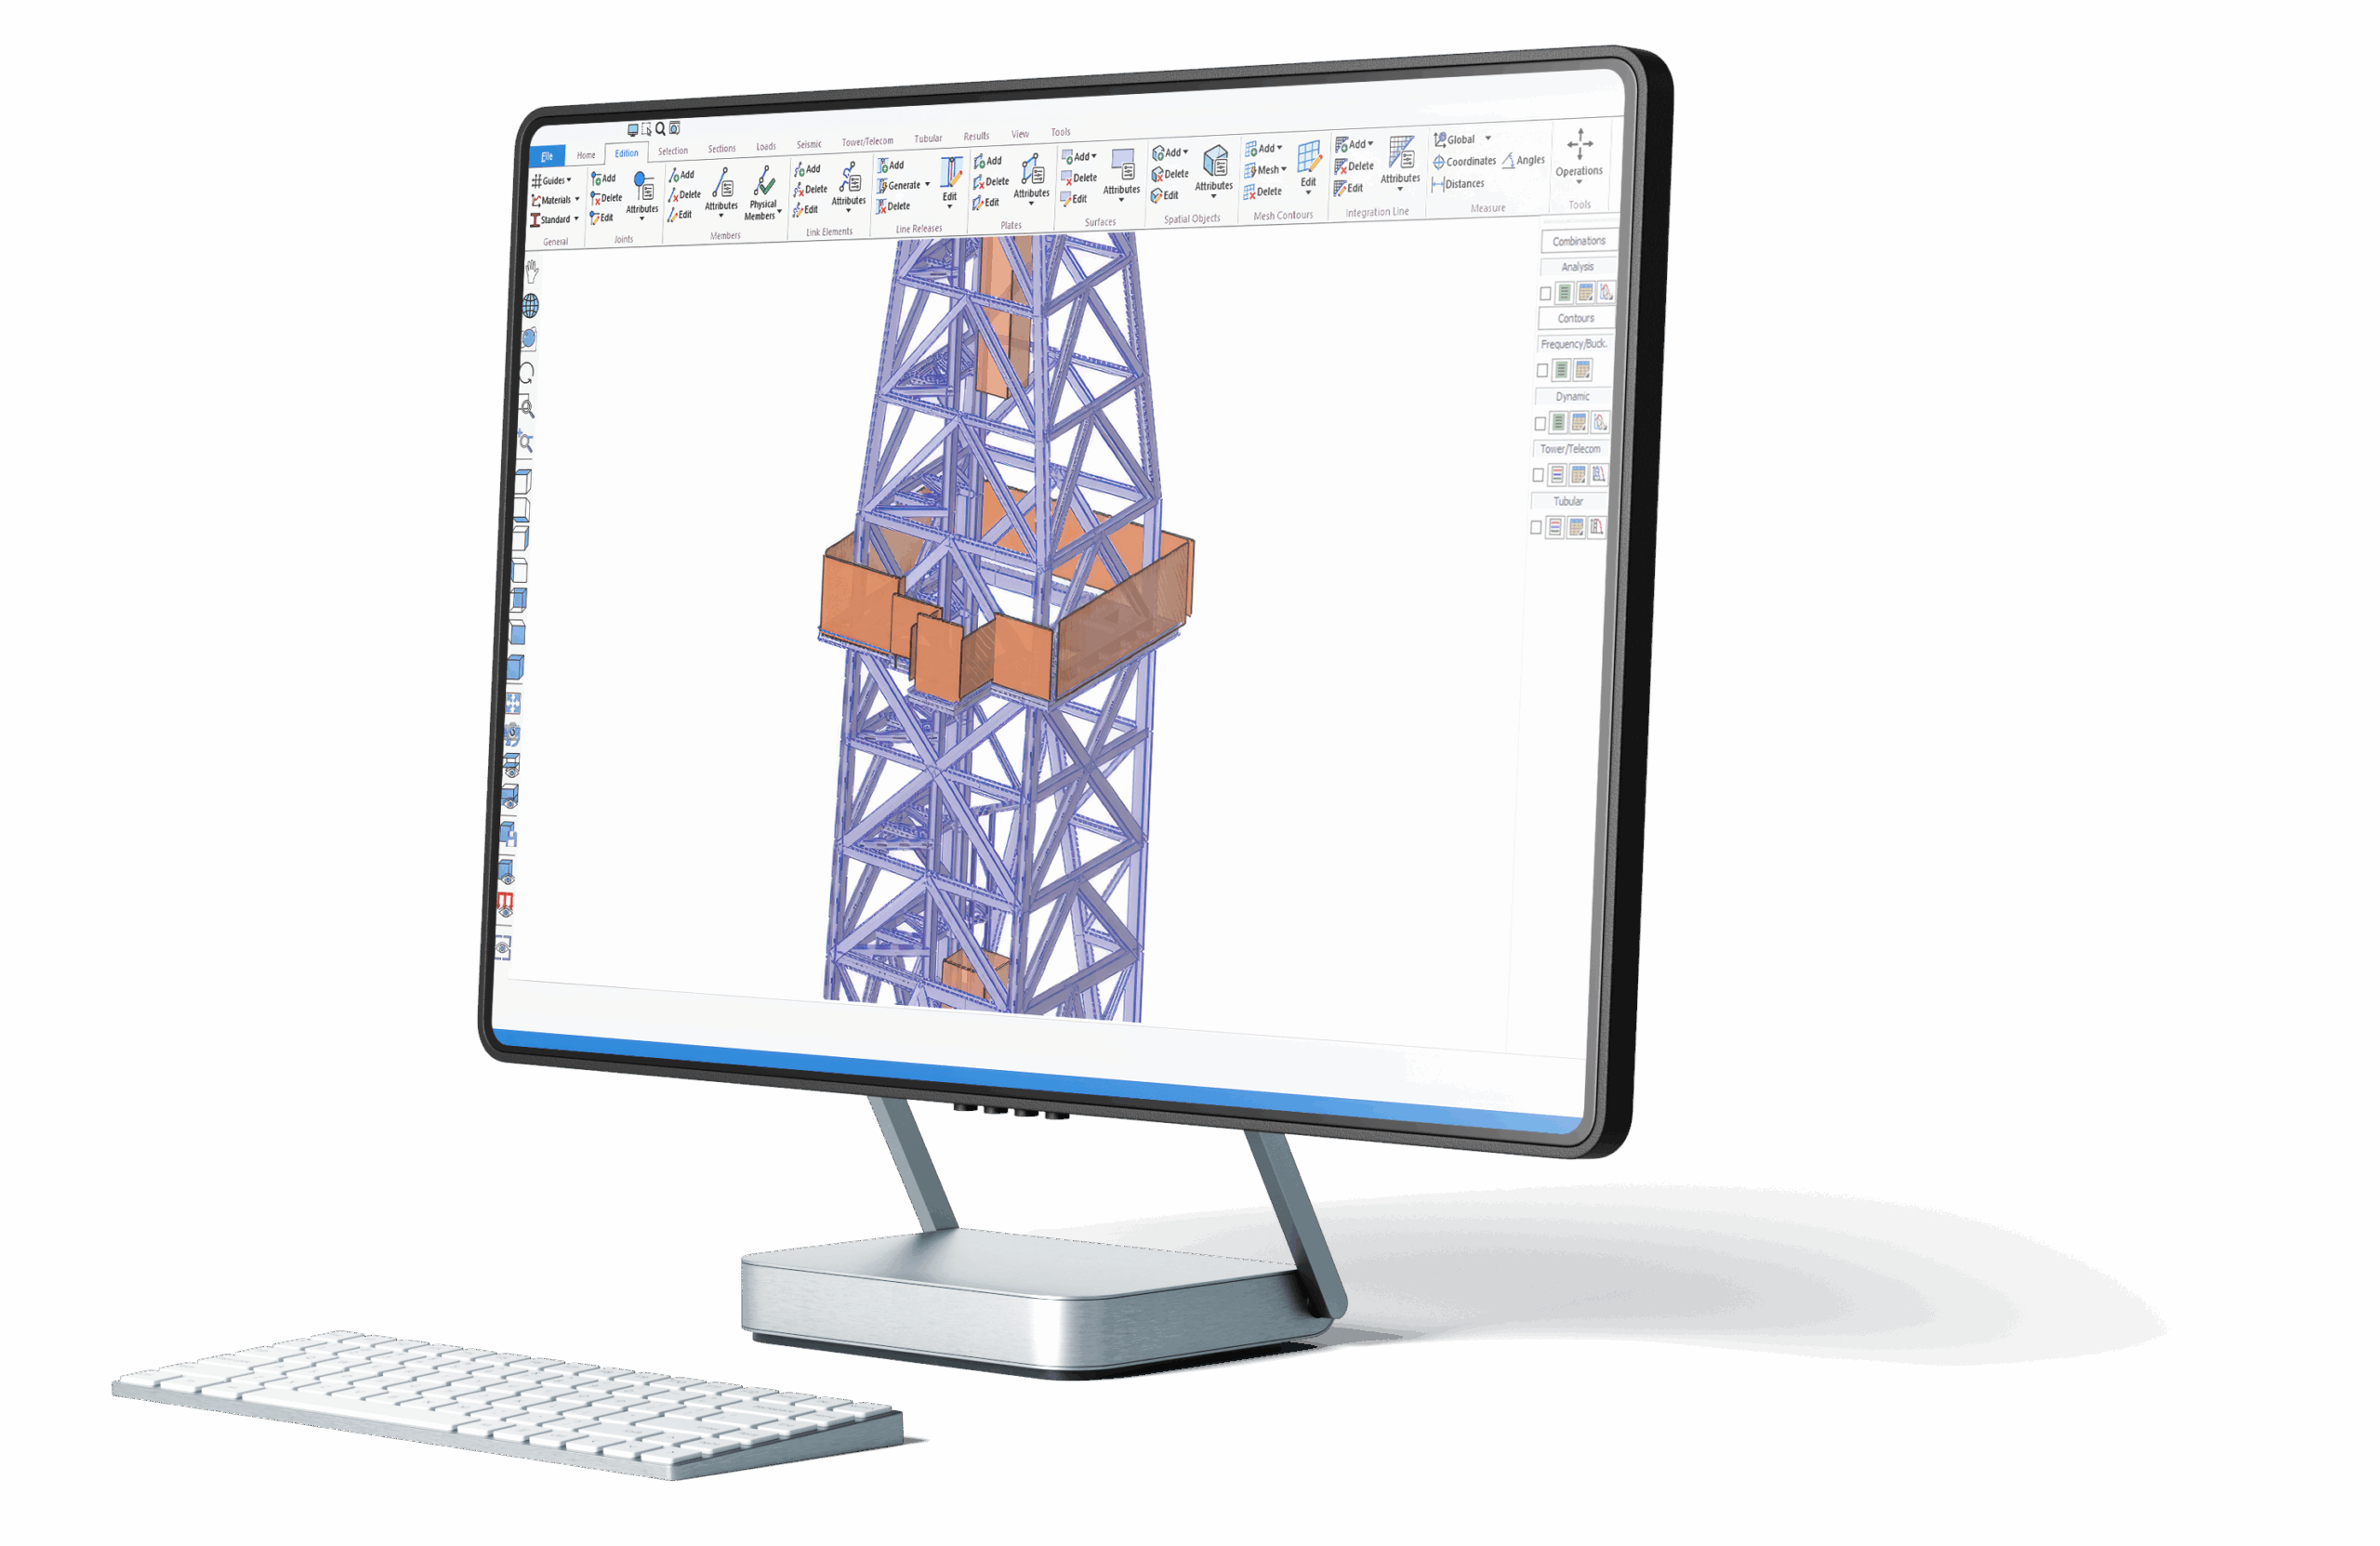
The Petroleum Structural Engineering® (PSE) software specializes in Offshore Structural Analysis and Design for oil & gas drilling structures, including platforms, rigs, masts, and substructures in compliance to the API 4F 5th edition requirements.
This 3D frame analysis software offers intuitive modeling features, comprehensive structural analysis capabilities and powerful design tools. The PSE software is user-friendly, easy-to-use and built on a ribbon-based interface, offering a streamlined design element where tools, commands, and options are conveniently organized into tabs and groups for effortless access and navigation.
PSE Software - Petroleum Structural Engineering®
Offshore Structural Analysis and Design for oil & gas drilling structures, including platforms, rigs, masts, and substructures in compliance to the API 4F 5th edition requirements.
Need more information?
Take the next step to discover PSE Petroleum Structural Engineering® Software by completing the following form. One of our experts will get in touch with you shortly.
Structural Analysis
Structural Analysis
Robust Structural Analysis Suite
• Static linear
• P-Delta
• Static non-linear
• Buckling
• Natural frequency
• Static equivalent seismic analysis
• Dynamic analysis
• Time-history seismic analysis
• Modal analysis
• Verify input data
• Buckling analysis
• Advanced section stress
• Diaphragm analysis
• Horizontal notional loads
• Linear and exact non-linear cable elements (catenary cables)
• Automatic handling of unidirectional elements such as tension-only members
Applied Loads and Profiles
• Dead, wind, ice, and thermal loads
• User-defined wind loads
• Concentrated, uniform, trapezoidal loads on members and joints
• Spatial object loads
• Automatic calculation of wind pressure, drag coefficients, and gust and topography factors
The PSE® Software offers comprehensive structural analysis capabilities, including P-Delta, nonlinear, buckling, frequency, seismic, and dynamic analyses, with fully integrated design verification.
Advanced Structural Analysis
Advanced Structural Analysis
Direct Analysis Method
• PSE® accounts for the reduced sectional properties for hollow structural steel sections in the standard AISC section library of the Steel Construction manual AISC 14th edition.
• It includes the Direct Analysis Method (DAM) and the Effective Length Method (kL) for AISC 360-16 standard
• The DAM considers initial imperfections using notional loads, it reduces the stiffness according to AISC 360-16
• Semi-automated command to calculate the buckling factors (K)
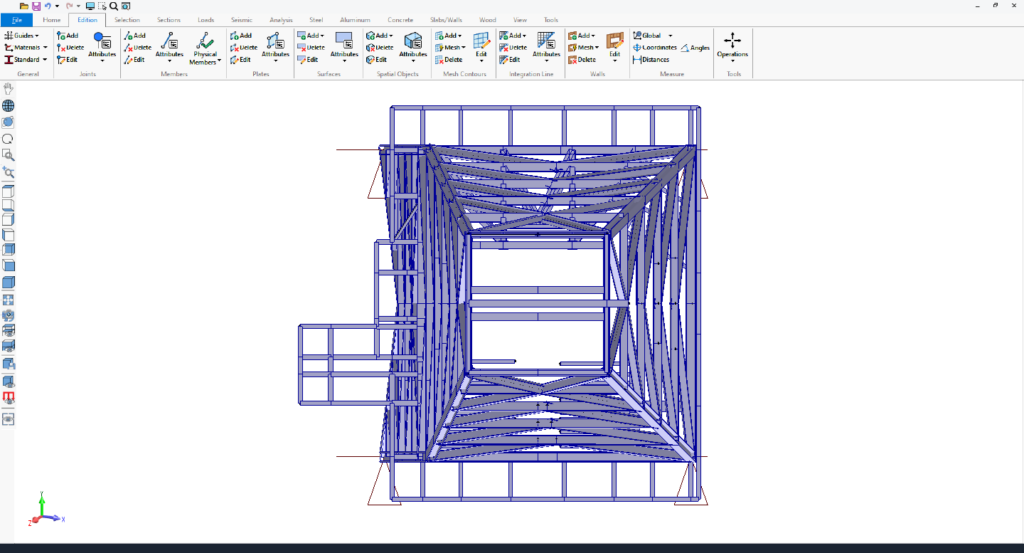
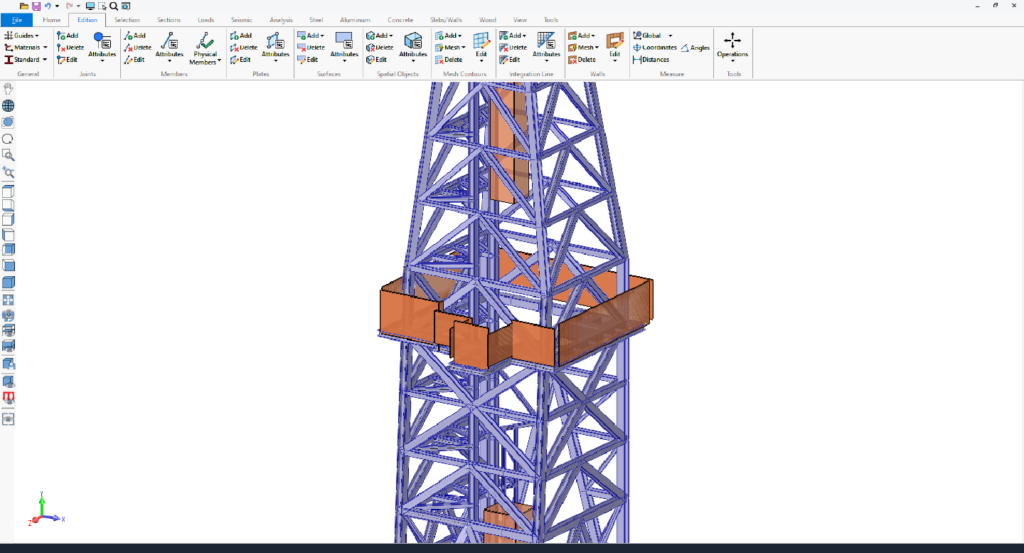
Spatial objects & spatial loads
• Spatial objects are used to model non-structural secondary elements attached to the structure. These elements add no stiffness to the existing model.
• Loads applied to spatial objects are transferred to the structure through one or more attach joints.
Built-up sections
• Advanced built-up sections editor.
• PSE® allows defining custom and pre-defined built-up sections whose properties are calculated by the means of a finite element model.
Core features of PSE® Offshore Structural Analysis software
A structural analysis software for Oil&Gas professional engineers.
Compliance with the API 5th Edition
PSE Petroleum Structural Engineering® software is based on the API 4F (5th edition) Specification for Drilling and Well Servicing Structures.
Wind loads, based on the velocity component approach, and vessel dynamic motions are defined according to API 4F Specification for Drilling and Well Servicing Structures. PSE® systematically incorporates the latest requirements and recommendations for suitable steel structures for drilling and well servicing operations for the Oil&Gas industry.
PSE® software is an innovative solution aiming to increase productivity of international companies helping them to achieve the most complex structural engineering projects.
Automatic wind wall calculation
Wind loads, calculated using the velocity component approach, are defined according to the API 4F Specification for Drilling and Well Servicing Structures (5th edition).
PSE® includes a specialized tool for generating wind and ice loads on open structures, such as drilling rigs. This feature enables automated calculation of wind and ice loads on each structural element.
PSE® software streamlines wind load application by computing loads based on projected area, projected pressures, or velocity components. It offers a range of wind profiles and automatically determines shape coefficients (drag factors) for accurate load estimation.
Automated Calculation of Member Unbraced Lengths
PSE® automatically determines unbraced lengths for structural members, ensuring accurate stability analysis. This feature optimizes design efficiency by eliminating manual calculations and improving reliability in load-bearing assessments.
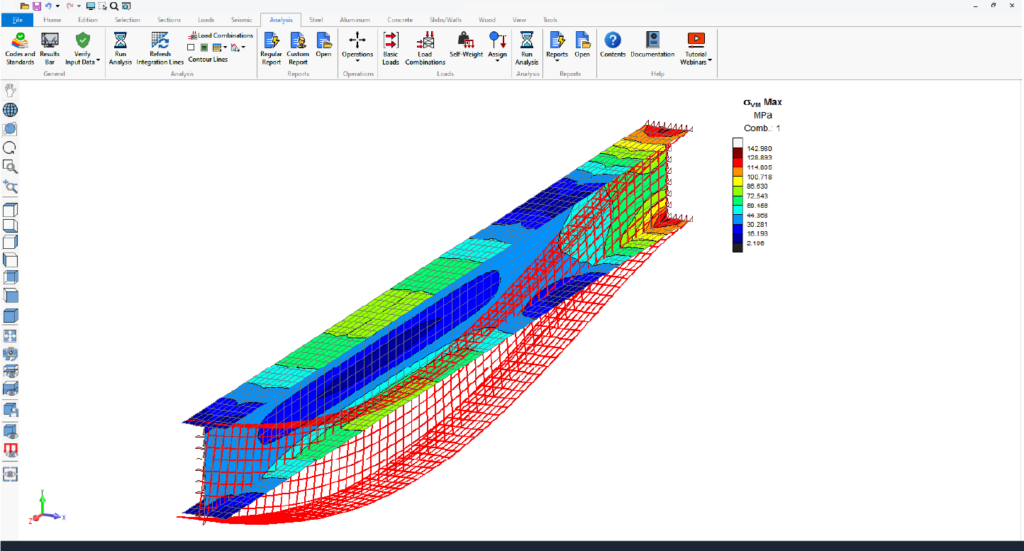
Robust and comprehensive structural analysis
PSE® features comprehensive state-of-the-art structural analysis methods, including:
• Finite Elements Analysis (FEA) including plates and shell elements
• P-Delta Analysis, Linear and Nonlinear Analysis, Buckling Analysis
• Static Equivalent Seismic Analysis, Seismic and Dynamic Time-History Analysis
• Non-linear analysis using load control and displacement control strategy
• Linear and exact non-linear cable elements
• Direct Analysis Method (DAM) and the Effective Length Method (kL) for AISC 360
• Possibility to add non-structural components using Spatial Objects and Spatial Loads to automatically calculate dead, ice, and wind loads
Structural insights animation
PSE® allows to animate analysis results, including static, P-Delta, buckling, seismic, and dynamic analyses. This visualization highlights displacements, internal forces, stresses, reactions, mode shapes, and time-history data, offering clear insights into structural behavior.
Animating envelopes focuses on critical regions, simplifying complex data for better decision-making during dynamic events.
Vessel Dynamic Motions
PSE® integrates advanced vessel dynamic motion analysis, adhering to the API 4F (5th edition) Specification for Drilling and Well Servicing Structures.
• Accurate inertial force calculation: Accounts for vessel dynamic motions and the impact of radial, tangential, and translational forces from mass acceleration.
• Comprehensive motion simulation: Models roll, pitch, and yaw rotations along with heave, sway, and surge translations, ensuring precise structural response analysis.
• Optimized for offshore environments: Designed for offshore drilling structures on vessels, semisubmersibles, and floating hulls, enhancing design reliability and safety.
Wave and Current Loads
PSE® provides advanced analysis of wave and current loads on submerged structural members in platforms and floating hulls, following API RP 2A specifications.
• Comprehensive load analysis: Accurately computes wave and current forces acting on structural members.
• Linear & nonlinear kinematics: Supports Airy’s linear theory and Fenton’s nonlinear theory for precise wave kinematics modeling.
• Optimized for offshore structures: Ensures stability and performance of submerged components in dynamic marine environments.
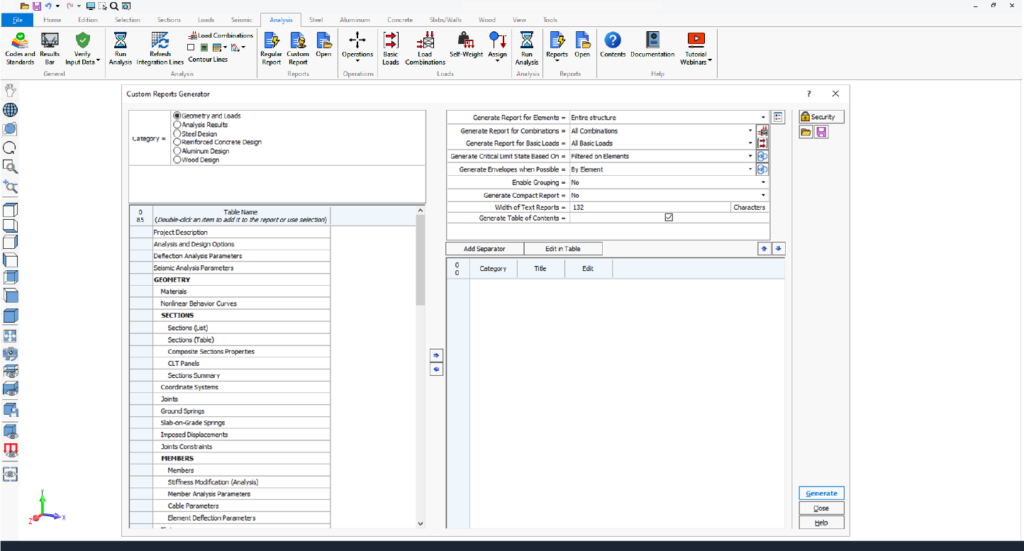
Advanced custom reporting
PSE® offers advanced custom reporting tools, enabling users to create tailored, professional reports with ease. With options to select relevant data, add individual or multiple tables, and customize settings, users can design layouts that meet specific project needs.
Editable titles, table reordering, and predefined templates enhance efficiency, while saved custom layouts streamline future reporting. Reports can be customized and exported to Microsoft Word and Excel, streamlining workflows.
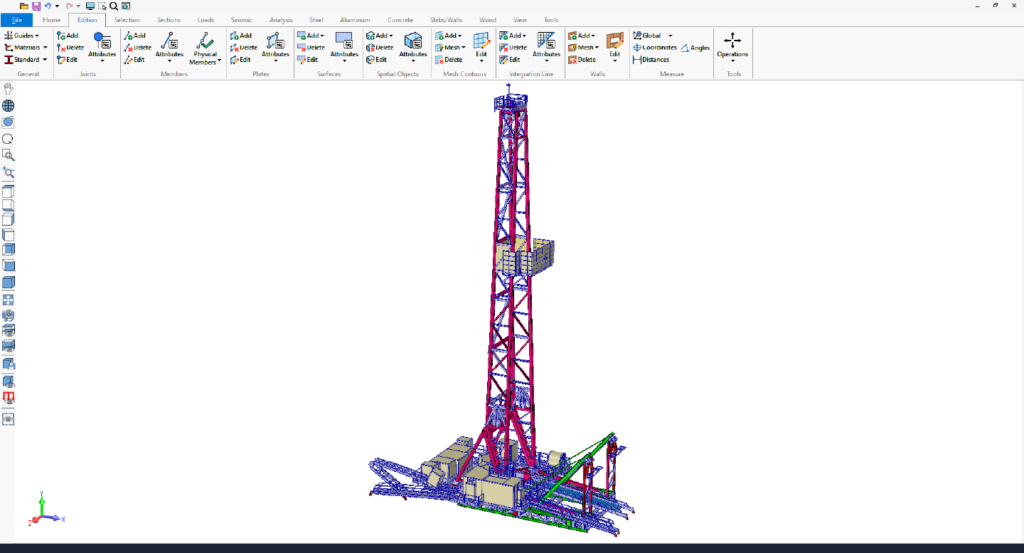
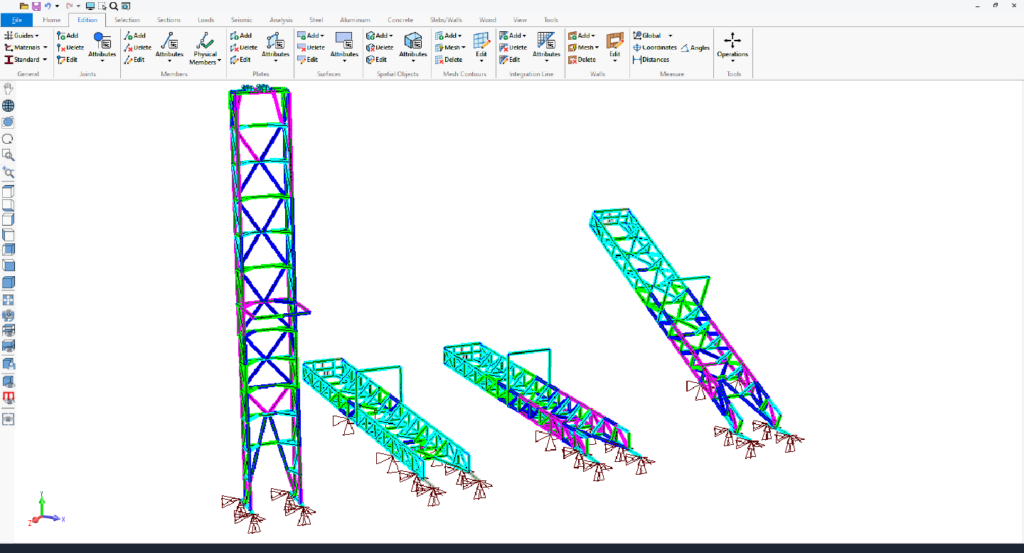
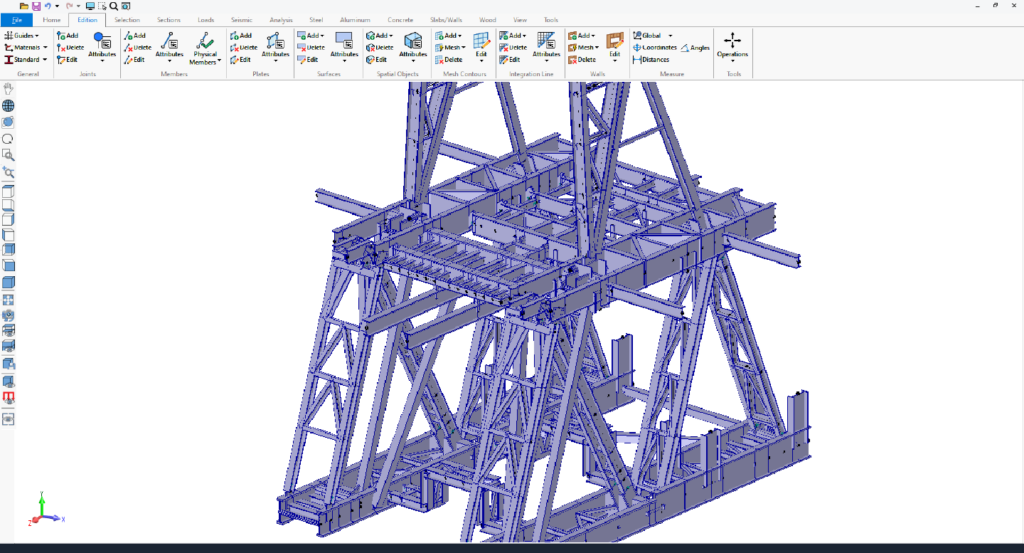
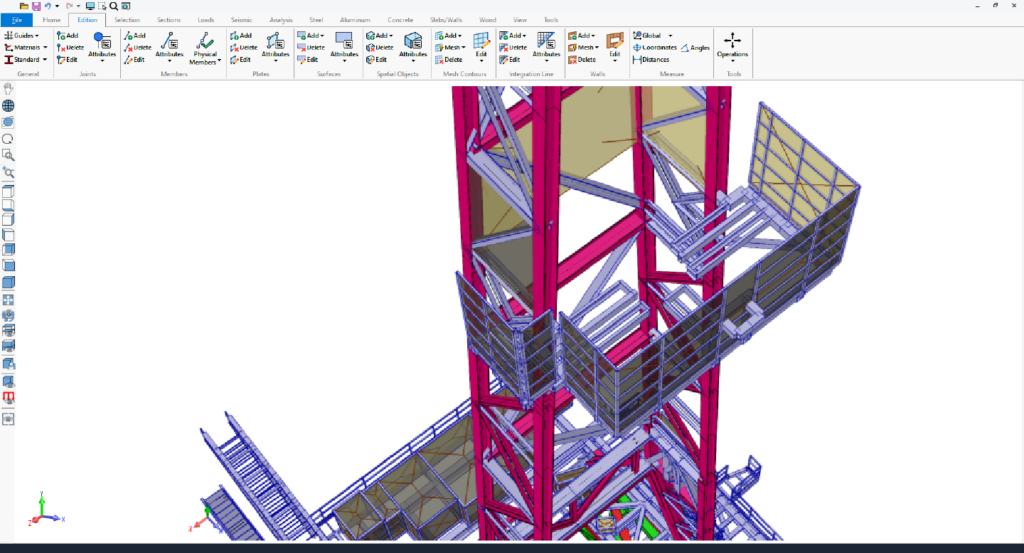
Intuitive graphical interface
PSE® features an intuitive, ribbon-based graphical user interface powered by DirectX 11 and OpenGL 2.0 for enhanced performance. Users can efficiently create, analyze, and design complex models, visualized as lines, wireframes, or 3D solids.
Users benefit from key functionalities such as detailed element creation, and transparency options for components like members, plates, surfaces, spatial objects and panels.
Additionally, powerful edition features allow to model very complex and non-standards towers. The software supports metric, imperial, and mixed unit systems, which can be modified at any time.
PSE® Software Reviews
Trusted to empower productivity since 1986
★★★★★ Rated 5 out of 5
''The SAFI PSE software was built with the engineer and designer in mind. The SAFI team has thought of every feature an engineer needs to design and optimize a structure. The program is very intuitive and easy to pick up. The support team is very responsive and knowledgeable. They can troubleshoot any modeling issue that comes up. ''
CHARLES VORA, PE
Veristic Technologies, Inc. - Houston, USA
★★★★★ Rated 5 out of 5
''The SAFI PSE software is one of the most suitable structural analysis and design tool for onshore and offshore rigs. I was fortunate to work in both environments and I find that it is closely tailored to the industry's compliance. What can I say about customer support? Imagine that customer support is just a call away, always available and knows exactly what I need. ''
Sugrim Sagar
M.Sc. P.Eng. - Texas, USA
Discover key features of Petroleum Structural Engineering® Software
A structural analysis and design software for professional Oil&Gas engineers.
Petroleum Structural Engineering® Key Features
Supported design codes
API 4F (5th Edition) – Specification for Drilling and Well Servicing Structures
• AISC 360 (LRFD and ASD)(American Institute of Steel Construction)
• AISC-LRFD-99
• AISC-ASD-89
• Both Direct Analysis Method (DAM) and Effective Length Method (kL)
• CSA S16 Canadian standard for steel structures
Wind Load Design – API 4F Integration
Wind loads are defined using the velocity component approach as per API 4F – Specification for Drilling and Well Servicing Structures (5th Edition).
PSE Integration:
The API 4F wind load methodology is fully integrated into the PSE Petroleum Structural Engineering® software.
Structural Classification:
Structures are classified based on:
Structural Safety Level (SSL)
Location: Offshore or Onshore
Design Reference Wind Velocity:
Defined as a 3-second gust wind speed
Measured at 10 meters (33 feet) above ground or sea level
Applicable in open terrain or water
Associated with a return period of 50 years or 100 years.
Automated Wind Load and Wind Wall Calculation
Automatically generates wind and ice loads on open structures, such as drilling rigs and derricks.
Element-Level Load Application:
Loads are calculated and applied individually to each structural element.
Wind Load Calculation Methods:
Supports:
Projected area method
Projected pressure method
Velocity component approach
Wind Profile Options:
Offers a range of predefined wind profiles for various conditions and terrain types.
Automated Drag Factor Determination:
The software automatically calculates shape coefficients (also known as drag factors) for structural members based on their orientation and exposure.
Wind enviroment
Model configuration based on wind conditions. PSE® allows to define different structural configurations depending on the specific wind environment the drilling structure will be exposed to.
The API 4F specifications are applicable to the following wind environments:
• Operational wind
• Erection wind
• Transportation wind
• Unexpected wind
• Expected wind
Automated shape factor
The shape coefficient (Cs) is automated in the PSE software for various section shapes. The program accounts for the gust factor (Gf) and the reduction factor for shielding (Ksh) for members and appurtenances.
Vessel motions
Standards-Based Definition:
Vessel dynamic motions are defined in accordance with API 4F (5th Edition) – Specification for Drilling and Well Servicing Structures.
Dynamic load considerations:
The software accounts for inertial forces resulting from vessel motion including:
Radial, tangential, and translational forces caused by the acceleration of attached masses (e.g., equipment, derricks)
Types of Vessel Motion Considered:
Rotational Motions:
Roll – Rotation around the longitudinal axis
Pitch – Rotation around the transverse axis
Yaw – Rotation around the vertical axis
Translational Motions:
Heave – Vertical motion
Sway – Lateral motion (side-to-side)
Surge – Longitudinal motion (front-to-back)
Internal forces
PSE® software calculates inertial forces generated by vessel dynamic motion, including:
• Radial forces
• Tangential forces
• Translational forces
To estimate inertial forces resulting from vessel dynamic motions, PSE® accepts three types of user input:
• Linear displacements, angular rotations and time periods
• Linear and angular velocities and accelerations
• Linear accelerations at two points in the vessel which are converted to linear and angular accelerations by the program.
Waves and current loads
Wave and current-induced forces are calculated in accordance with API RP 2A – Recommended Practice for Planning, Designing, and Constructing Fixed Offshore Platforms.
Wave Kinematics Models
PSE supports two methods for defining wave motion and kinematics:
Airy’s Linear Wave Theory
Fenton’s Nonlinear Wave Theory
Waves profiles
PSE® accounts for the following wave profiles and kinematic parameters:
• Wave period
• Incidence angle
• Elevation of the sea bed
• Elevation of the still water line (SWL)
• Kinematic reduction factor
• Crest position criterion
Preview of the wave surface profiles, velocities and accelerations at any point is readily available.
Current profiles
In the PSE software, the current profile is described with respect to the sea bed. The current speed is defined by a set of elevation-velocity-angle triplets and the reduction of the current speed in the vicinity of the structure or the blockage factor is accounted for.
In order to combine the current with the wave profile, the current needs to be stretched, or compressed, to the local wave surface. Two stretching methods are available:
- The linear stretching method, also known as the Wheeler stretching
- The nonlinear method, or hyperbolic stretching
Design and verification in compliance with American Standards
Complies with AISC 360-16 (both LRFD and ASD design methodologies).
Also supports:
AISC-LRFD-99
AISC-ASD-89
Handles design under multiple loading conditions:
Axial compression
Bending
Tension
Combined axial-flexural loads
Shear
Torsion and warping
Capabilities
Supports both:
Direct Analysis Method (DAM) – includes:
Initial imperfections
Stiffness reduction per AISC 360-16
Effective Length Method (kL)
Semi-automated buckling factor (K) computation command available
Features and Standards
Standard section libraries:
CISC, AISC, European
Parametric profiles (e.g., I, H, T, L, hollow, round)
Customizable resistance parameters:
Unbraced lengths
Buckling lengths and factors
Editable via:
Graphical interface
Spreadsheets
Complies with multiple codes:
CAN/CSA S16
AISC ASD & LRFD
Eurocode 3 & 4
CSA S136
AISI S100
Supports:
Symmetric, asymmetric, and built-up sections
Steel verification
Includes:
Classification, strength, and stability checks
Evaluates steel members under:
Bending
Compression
Tension
Shear
Combined load effects
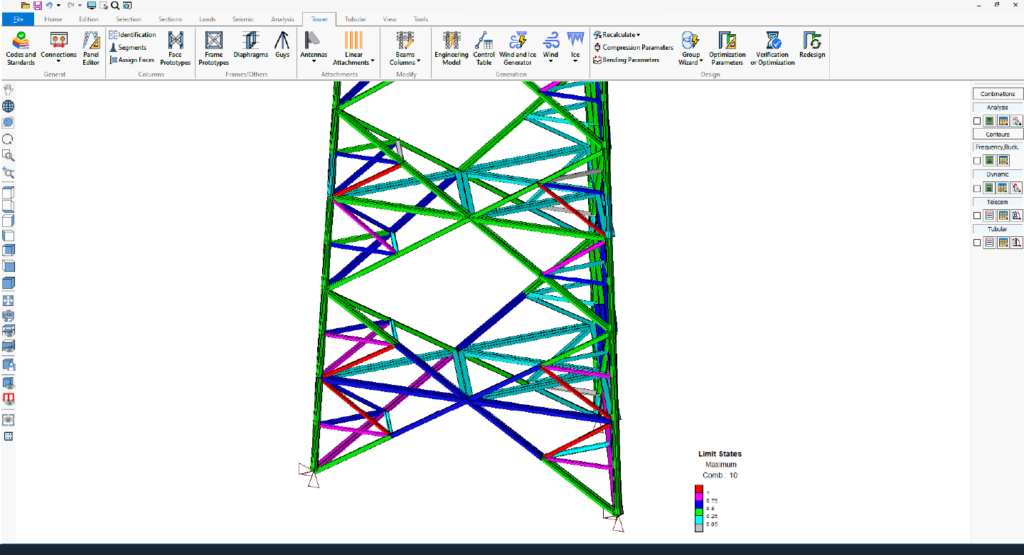
Limit states
Limit state design outputs:
Color-coded for easy interpretation
Displayed graphically on the 3D model through color representation or presented numerically in spreadsheets and reports
Discover why professional engineers are choosing PSE®.
A technology compliant with the API Specification for Drilling and Well Servicing Structures (5th Edition).
Ready to get started? Contact us today to explore the PSE® software.